

Spark Sustainability
The Free Energy City
Energy is the ingredient for human existence and prosperity.
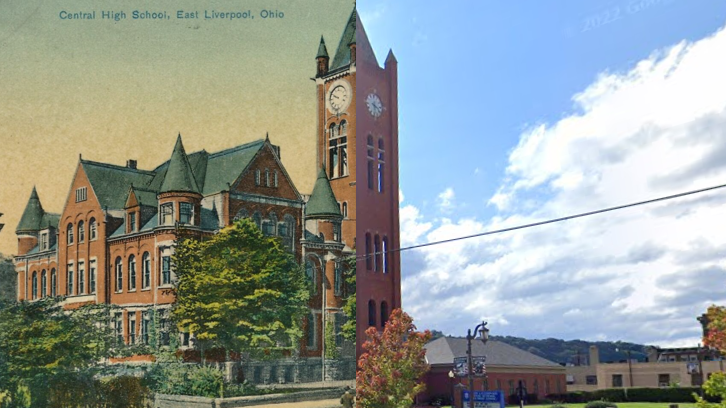
1895 East Liverpool Central School contrasted with the 1992 Alumni Association Reconstruction
Spark Sustainability is delving into the captivating narrative of East Liverpool, Ohio, a city that once thrived on abundant and freely available natural energy resources. However, the tale took a turn when the scarcity of these valuable energy sources began driving up the cost of conducting business, eventually leading to a dramatic collapse in the city's population.
The decline experienced by East Liverpool mirrors a broader trend observed in numerous cities across Western Pennsylvania, Eastern Ohio, and the Northern West Virginia panhandle. These areas reached their zenith in the 1950s, only to witness a subsequent decline in population. Notably, this decline exhibits a strong correlation with the shifting dynamics of energy production, predominantly focused on coal.
By examining the story of East Liverpool and its striking similarities to the wider region, Spark Sustainability aims to shed light on the intricate relationship between energy resources, economic vitality, and population trends. Hopefully this site will help you to uncover some valuable insights that can contribute to sustainable solutions and guide decision-making in the face of evolving energy landscapes.
Peak East Liverpool


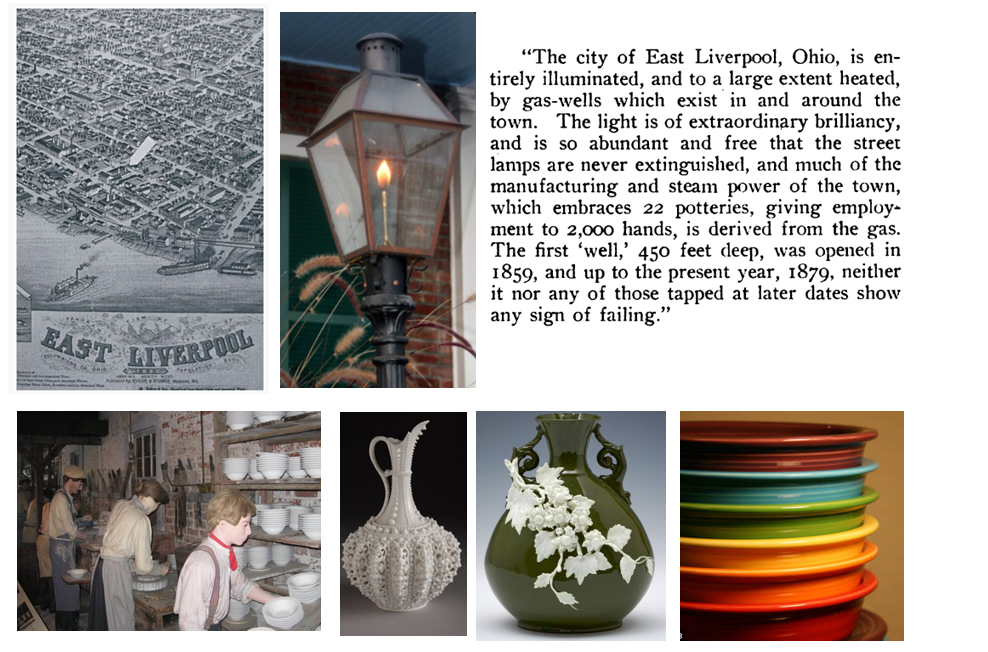
Former ceramics manufacturing capital of the world.

Free Energy City
(Part 1 of 2)
The True Story of East Liverpool, Ohio
This part features:
The Point of Beginning;
The Salt Wells of Salineville;
The "Unlimited" natural gas wells of East Liverpool, Ohio.
Free Energy City
(Part 2 of 2)
The True Story of East Liverpool, Ohio
This part features:
The Age of Coal (Carnegie, Westinghouse, Tesla);
The Age of Atomic Energy (Shippingport);

Buy the Book!
Support sparkstarter’s first book. Explore the history of America’s energy revolutions from the vantage point of East Liverpool, Ohio. Discover some surprising facts about energy and the city where energy was once free! A sample of the book is available at the link.
Pre-Order Now!
Release Date January 2024

1887 East Liverpool Water & Fire Protection for 10,000 people.
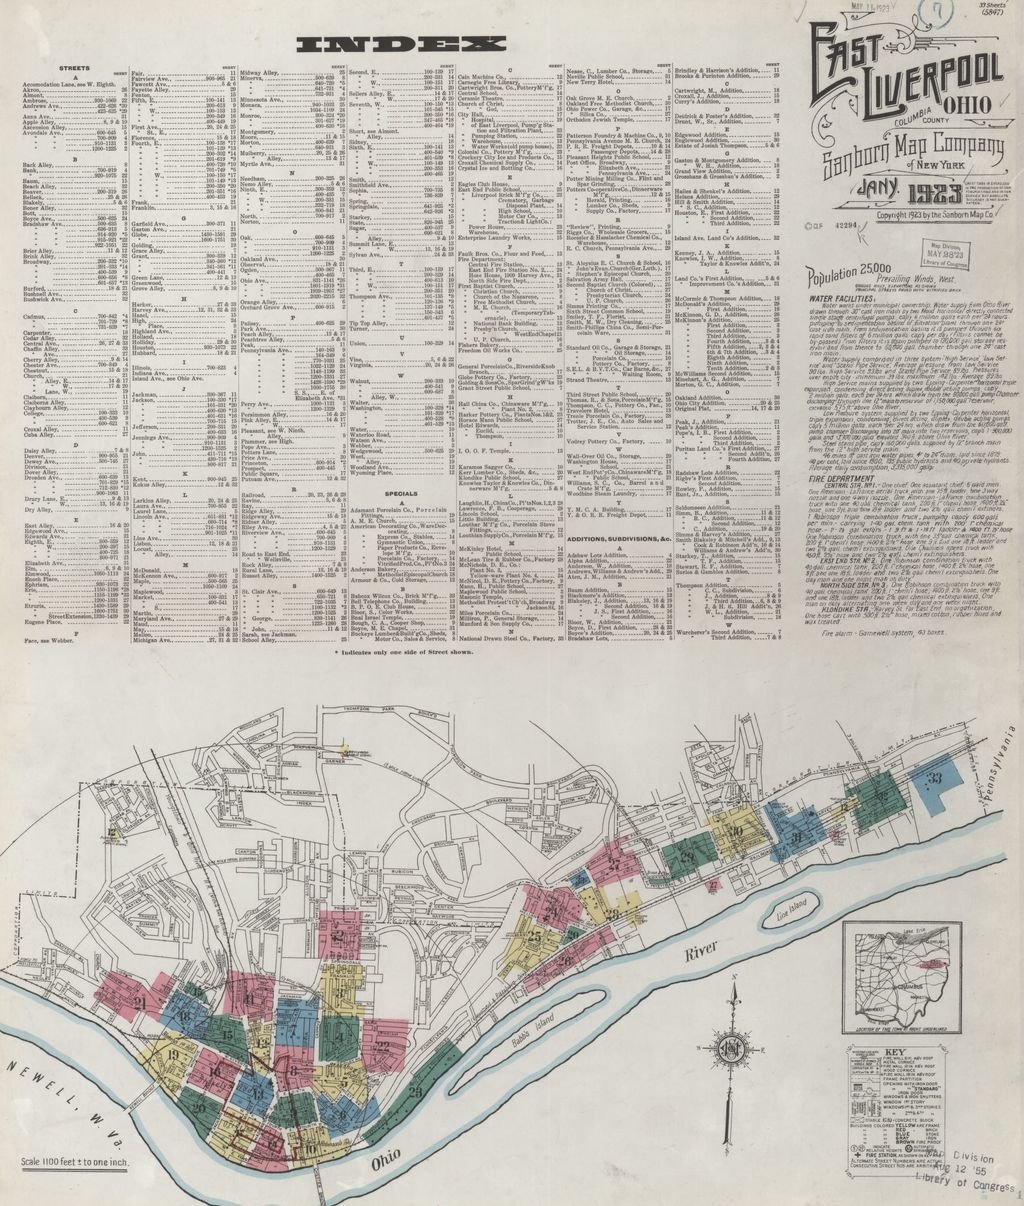
1923 East Liverpool Water & Fire Protection for 25,000 people.

East Liverpool, Ohio Peak Population Calculator
East Liverpool OH Population Data and Ohio Coal Mine Production Data show decline in the 1950’s and 1960’s with a map of abandoned coal mines in Columbiana County.
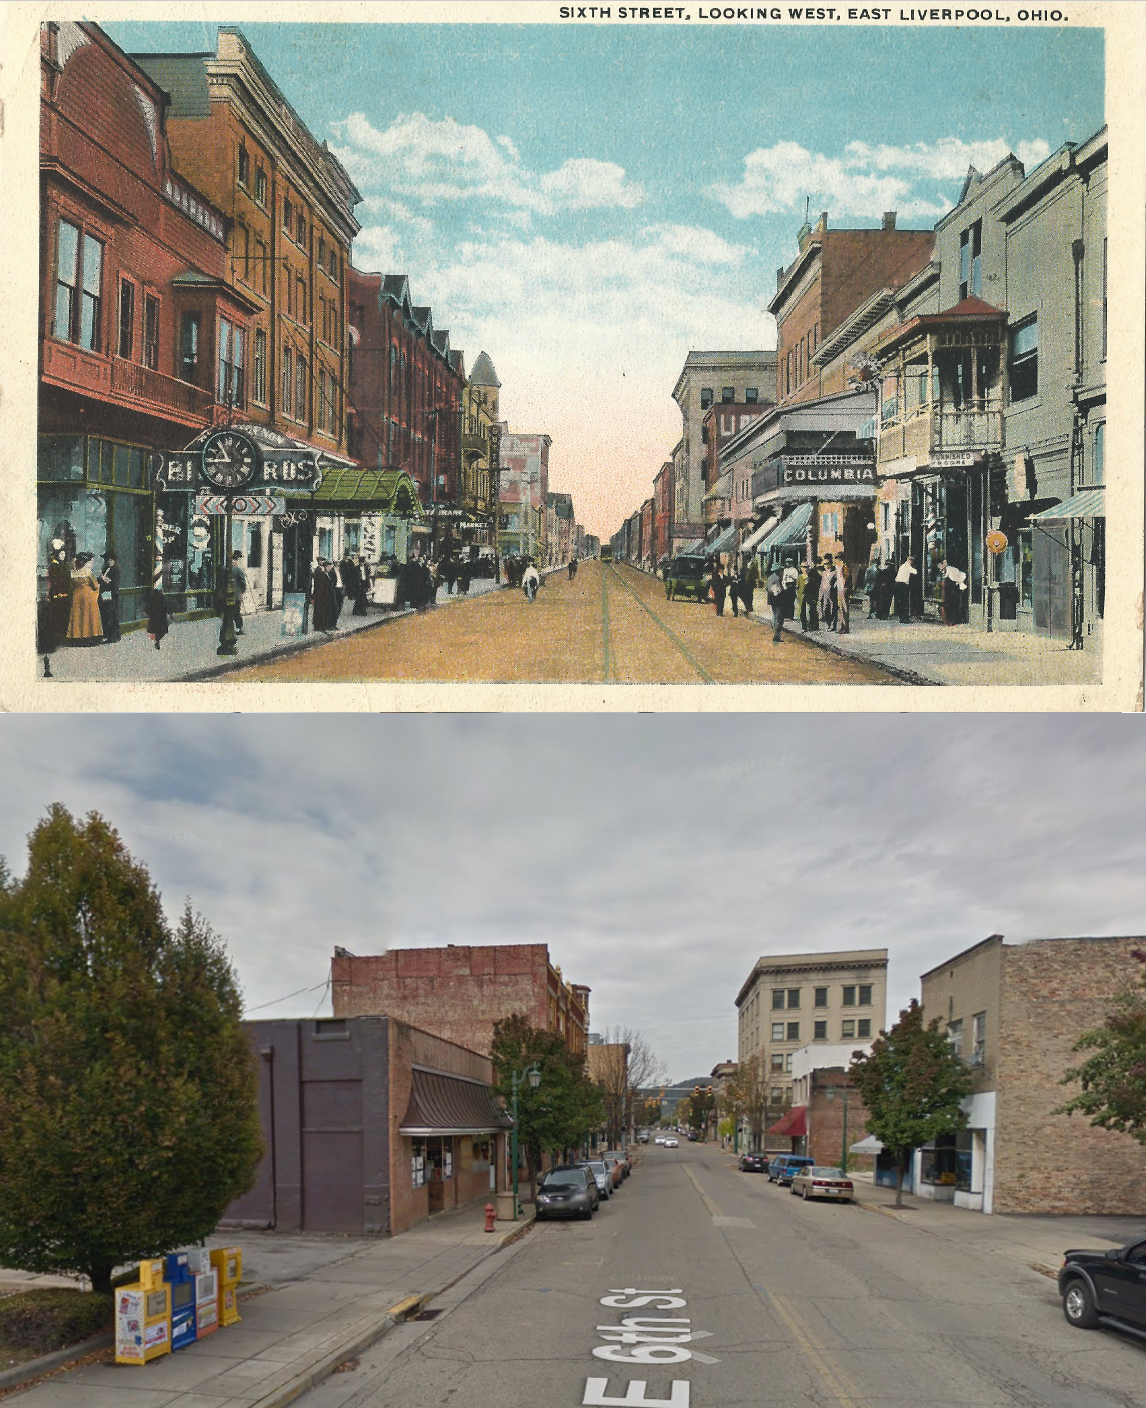
East Liverpool, Ohio : Circa 1920 Top, 2020 Bottom
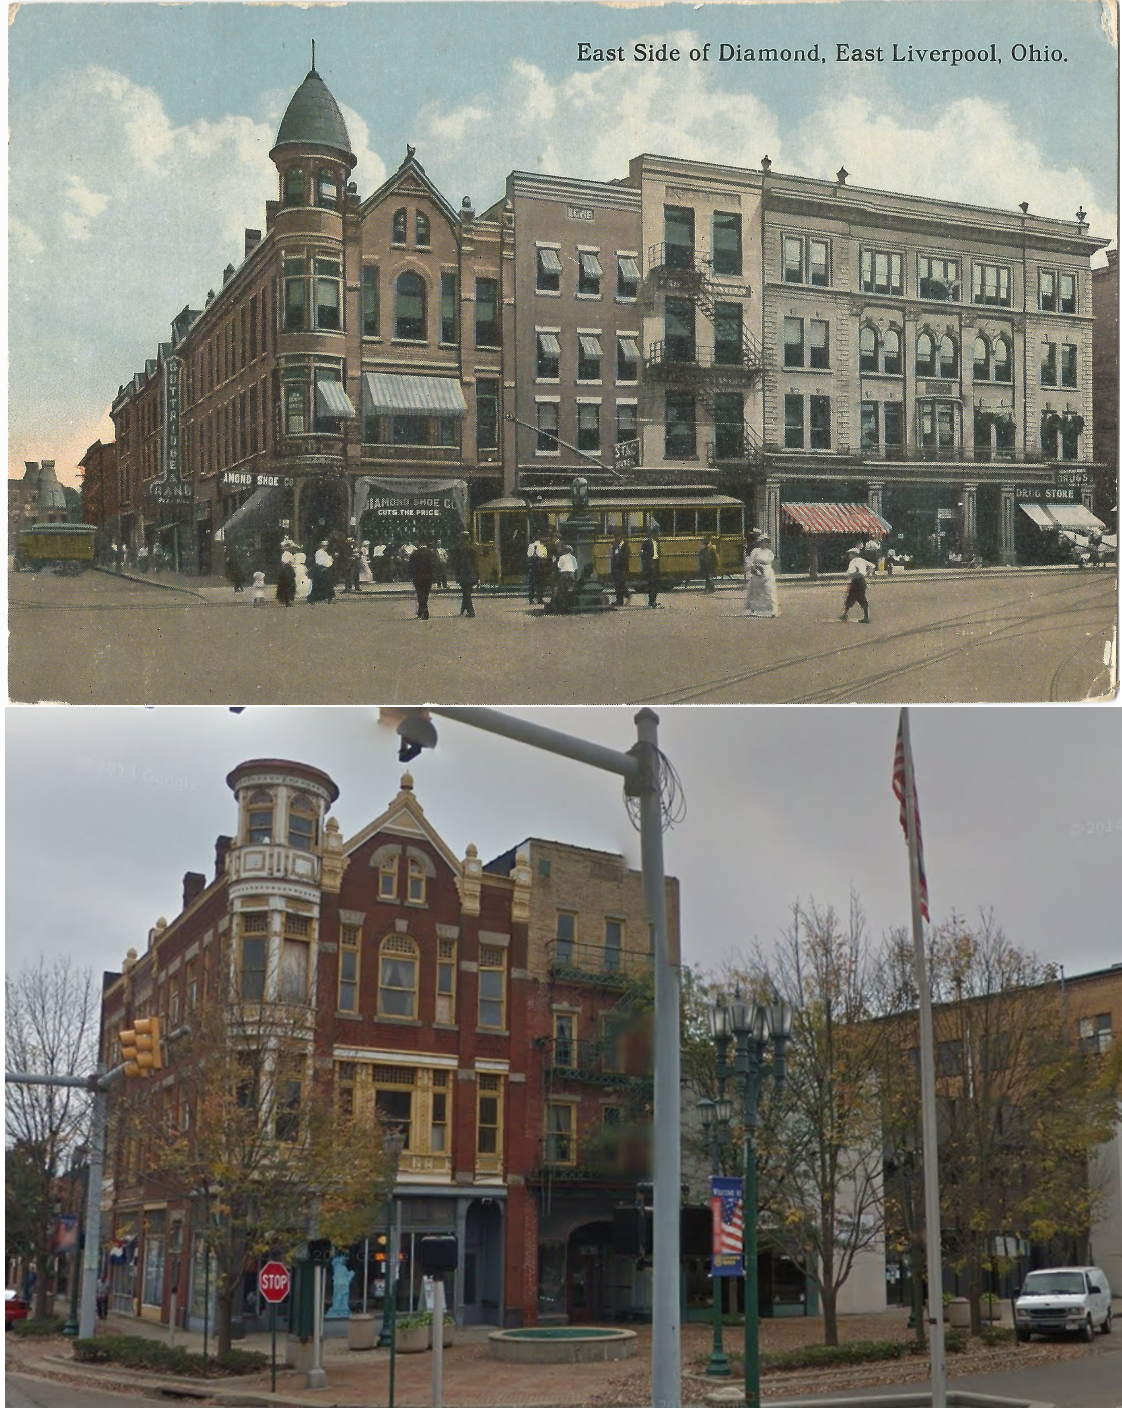
East Liverpool, Ohio : Circa 1920 Top, 2020 Bottom
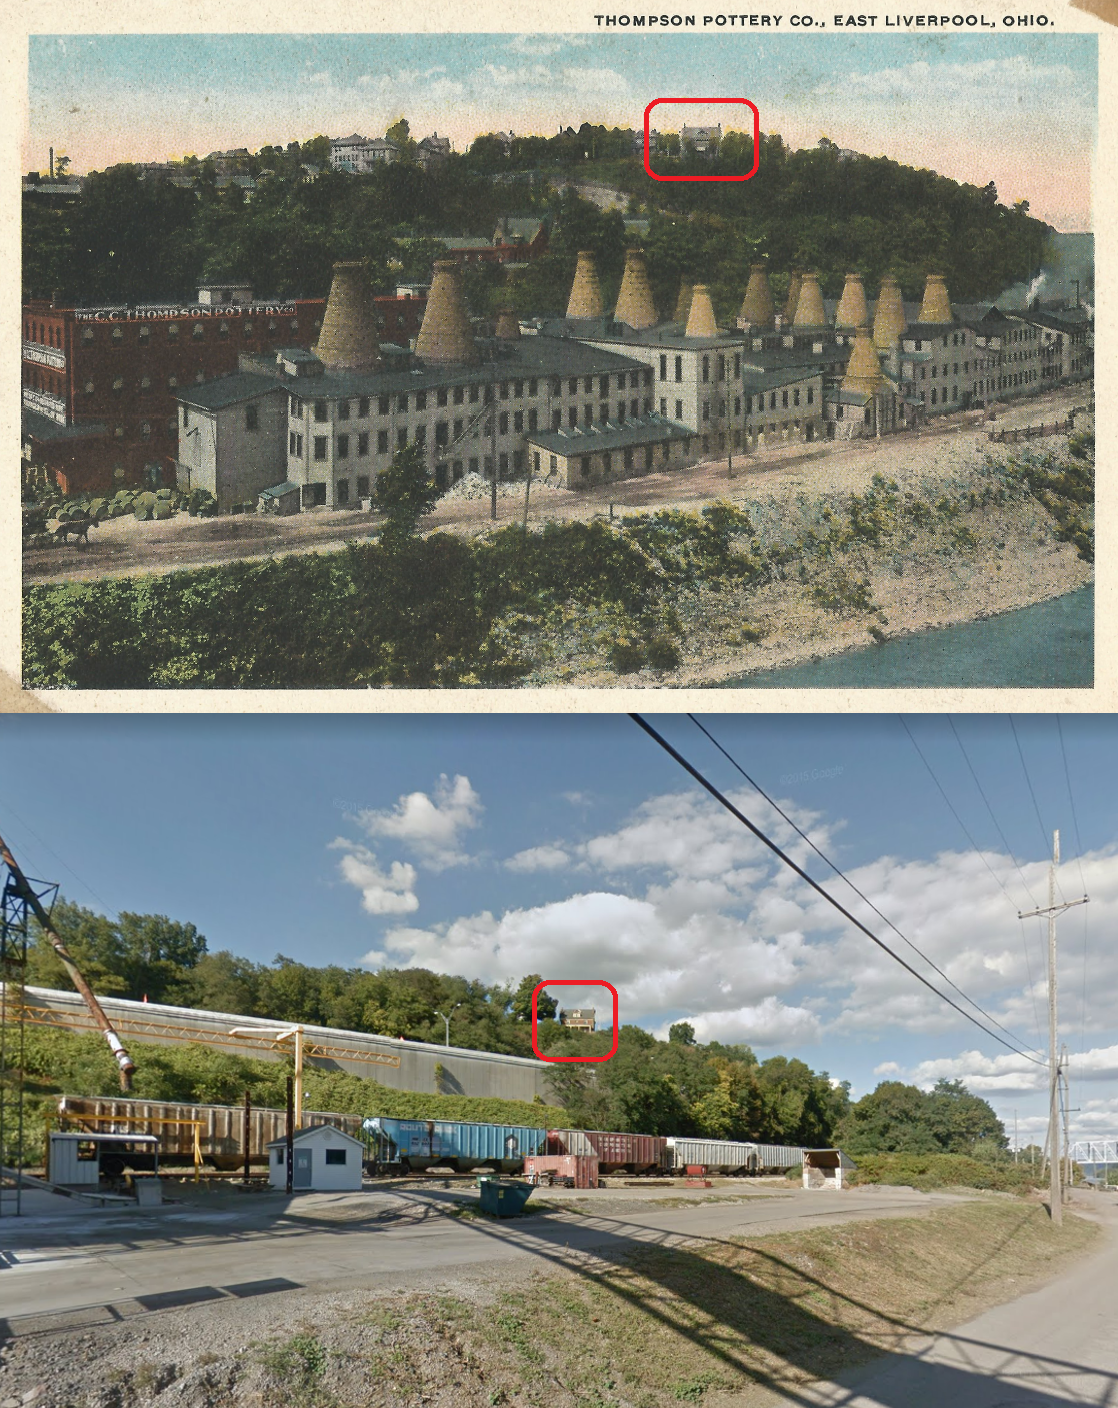
East Liverpool, Ohio : Circa 1920 Top, 2020 Bottom

East Liverpool, Ohio : Circa 1920 Top, 2020 Bottom
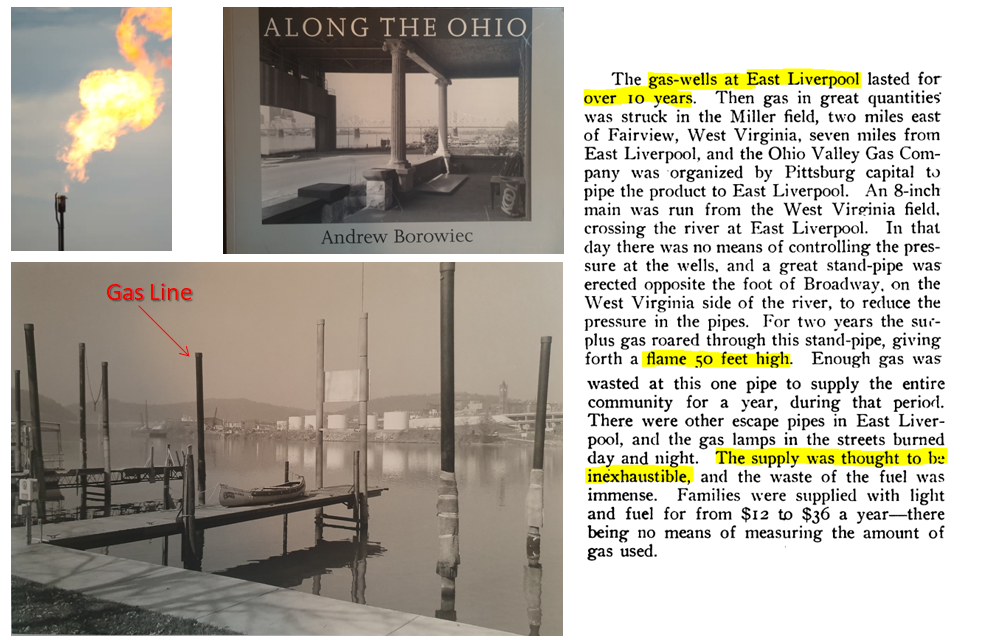
By 1905 East Liverpool's Natural Gas Wells were exhausted, well failures were common in the late 1880's and 1890's. Pipes from the old gas line can still be found at the former site of the 50ft. gas flame. (Source History of Columbiana County by McCord)
From 1860 to 1880 East Liverpool's Natural Gas Wells were thought to be an unlimited resource. Pottery factories of this era took advantage of what was essentially free energy. (Source History of Columbiana County by McCord)
East Liverpool was formerly energy self sufficient and had so many local brands… brewery, dairy, whiskey, sodas, and drug labels. All gone.

Glass Company located in Monaca, PA
The local vendors had custom bottling produced in one of the many glass factories that existed in and around East Liverpool, Ohio taking advantage of the abundant shallow natural gas wells.
Peak Pittsburgh


Former coal extraction and steel manufacturing capital of the world.

Peak Pittsburgh Video
Discussion of the population collapse of Pittsburgh that began in the 1950s at 700,000 people and decreased to 350,000 people by the 1990s. The collapse continues today but at a slower rate.

Pittsburgh PA, Year: 1787, Population: 400, plenty of Coal to use.

Pittsburgh PA, Year: 1902, Population: 320,000, exponential use of Coal.

Peak Pittsburgh Calculator
PA Coal Mine Production Data and Pittsburgh PA Population Data compared to show Pittsburgh’s Population decline as related to the collapse of coal production in the 1950’s.

Map of Pennsylvania Coal Fields

Map of abandon Pennsylvania Coal Mines.
Peak Appalachia
-

East Liverpool
Peak Population 25,000 people in 1950’s
-

Wheeling
Peak Population 60,000 people in 1950’s
-

Youngstown
Peak Population 175,000 people in 1950’s
-

Pittsburgh
Peak Population 700,000 people in 1950’s
-

Parkersburg
Peak Population 45,000 people in 1960’s
-

Cleveland
Peak Population 900,000 people in 1950’s
Peak America ?

Peak Energy Per Person
in USA from 1950 to 2020
Graphs explore USA Energy Use and Population. The Energy available per Person in the United States Peaked in the 1970’s and has declined ever since.
Freedom and Power (1952) Video
In present day America circa the 2020’s it seems that all interest surrounds Political Power with a focus on what friends or foes get to own, control, and access resources.
In contrast 1950’s America had a keen focus on Thermodynamic Power. How to produce more power, give it to everyone, and maximize individual productivity.
Have we lost site of that vision?
When the Circuit Breaks: America's Energy Crisis (1975) Video
Sponsored by the U.S. Federal Energy Administration, Office of Communications and Public Affairs.
Video expresses the ambivalence with which Americans and their government have addresses sustainable energy issues. Promotes the achievement of U.S. self-sufficiency in energy by 1985.
